博文
借助Bowtie2软件分析基因组的测序深度
|
示例数据:
├── plasmid_genome.fa………………………………………………质粒基因组序列
├── reads_1.fq……………………………………………………测序数据read1
├── reads_2.fq……………………………………………………测序数据read2
操作:
步骤 1:使用 Bowtie2 进行比对
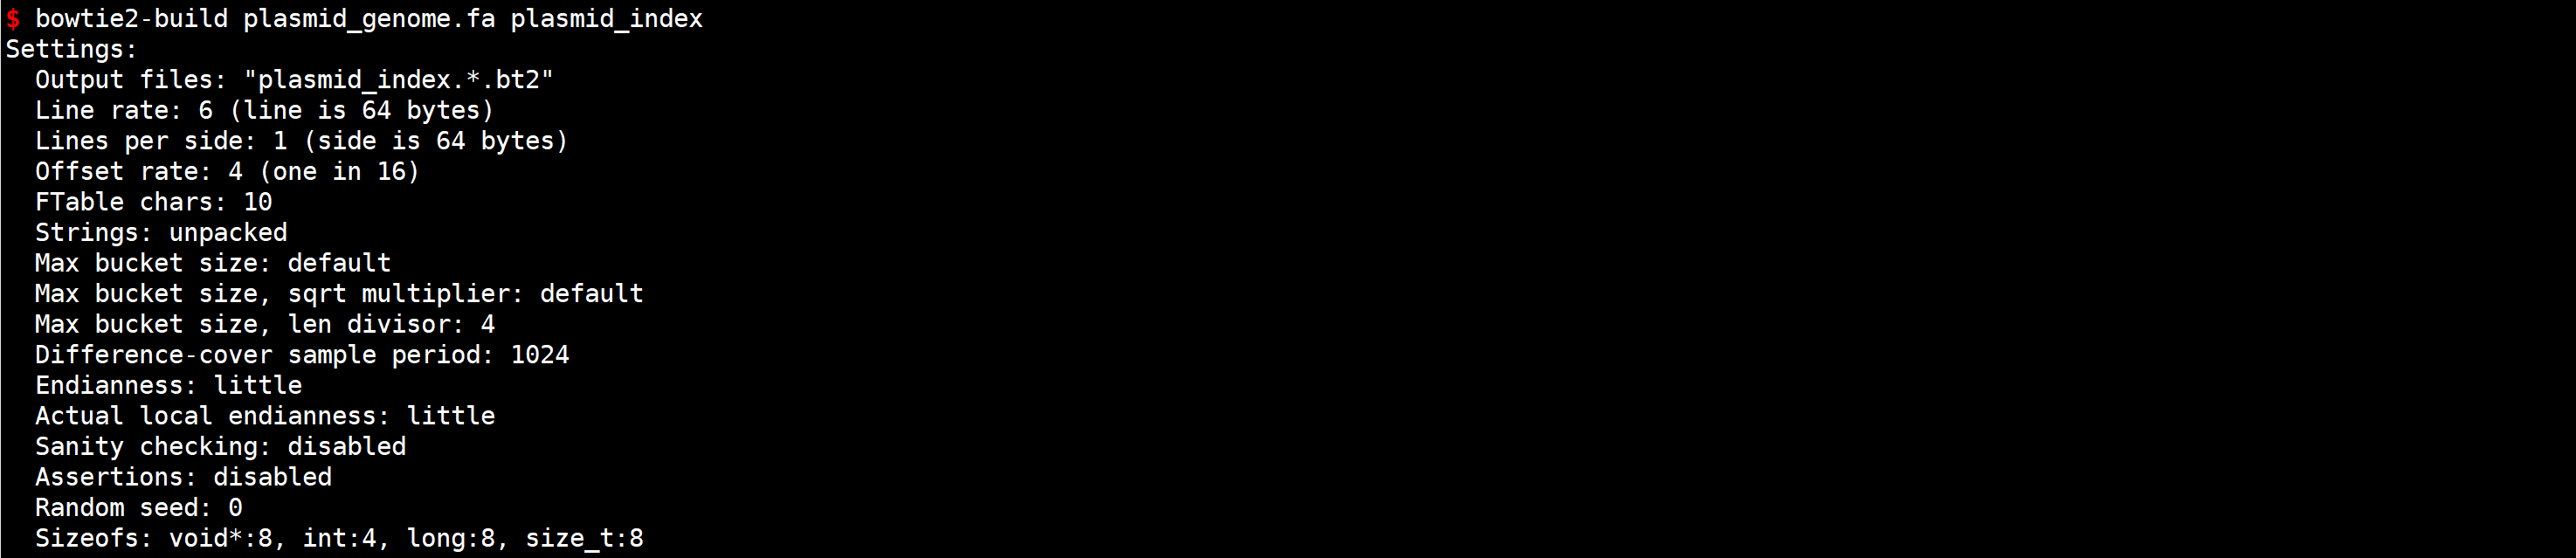
# 建立索引
bowtie2-build plasmid_genome.fa plasmid_index

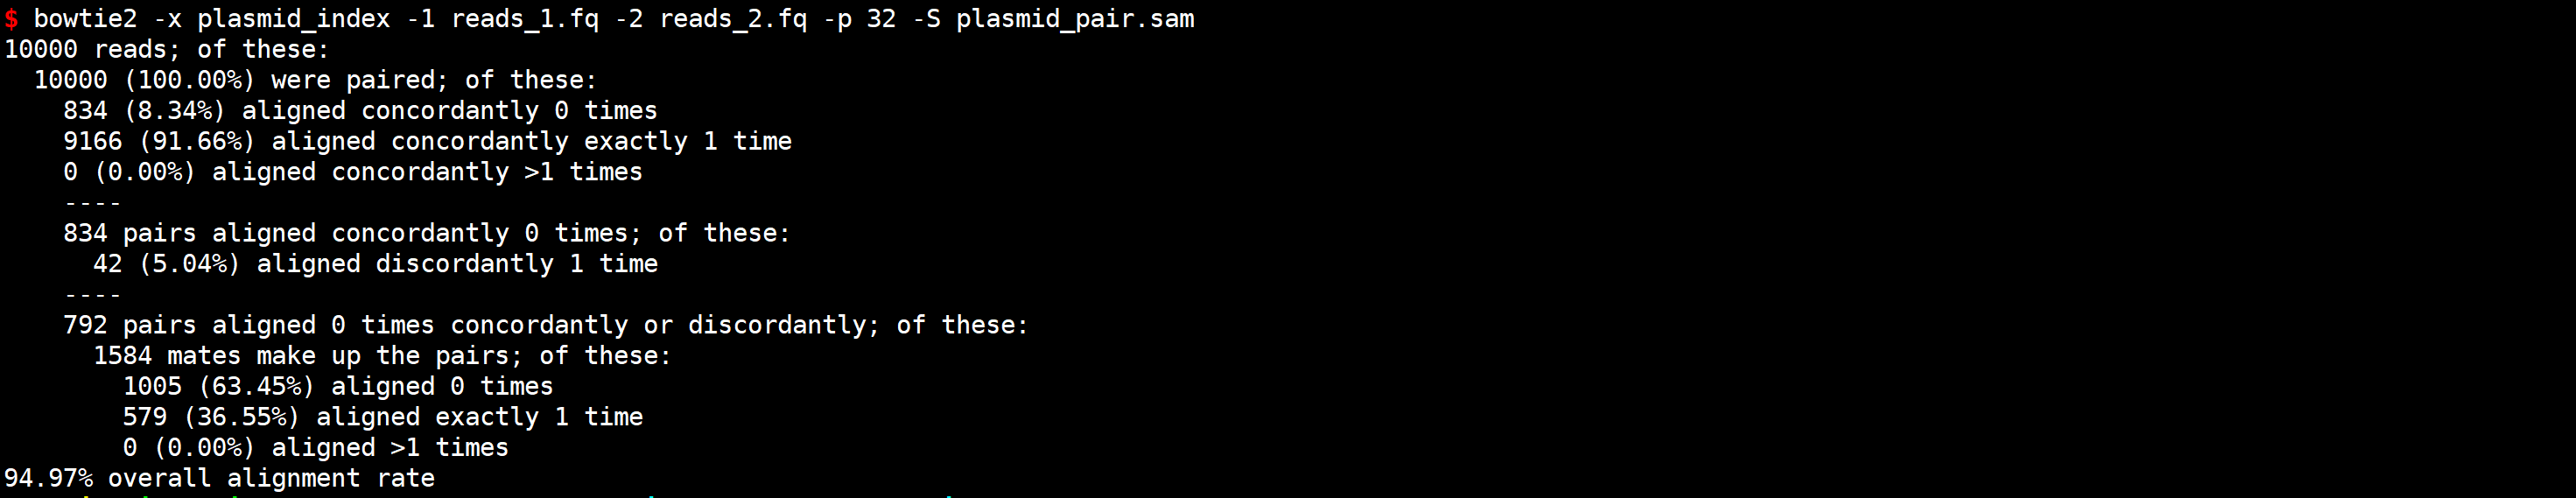
# 使用使用 Bowtie2 进行比对
bowtie2 -x plasmid_index -1 reads_1.fq -2 reads_2.fq -p 32 -S plasmid_pair.sam
步骤 2:使用 SAMtools 处理比对结果
# 将 SAM 文件转换为 BAM 文件
samtools view -Sb plasmid_pair.sam > plasmid_pair.bam
# 对 BAM 文件进行排序
samtools sort plasmid_pair.bam -o plasmid_pair.sorted.bam
# 为排序后的 BAM 文件建立索引
samtools index plasmid_pair.sorted.bam
# 生成测序深度文件
samtools depth plasmid_pair.sorted.bam > plasmid_pair_depth.txt
步骤 3:可视化测序深度
1)使用 IGV 可视化
2)使用 R 或 Python 进行绘图
示例代码如下:
#加载R包
library(ggplot2)
library(grid)
#导入数据
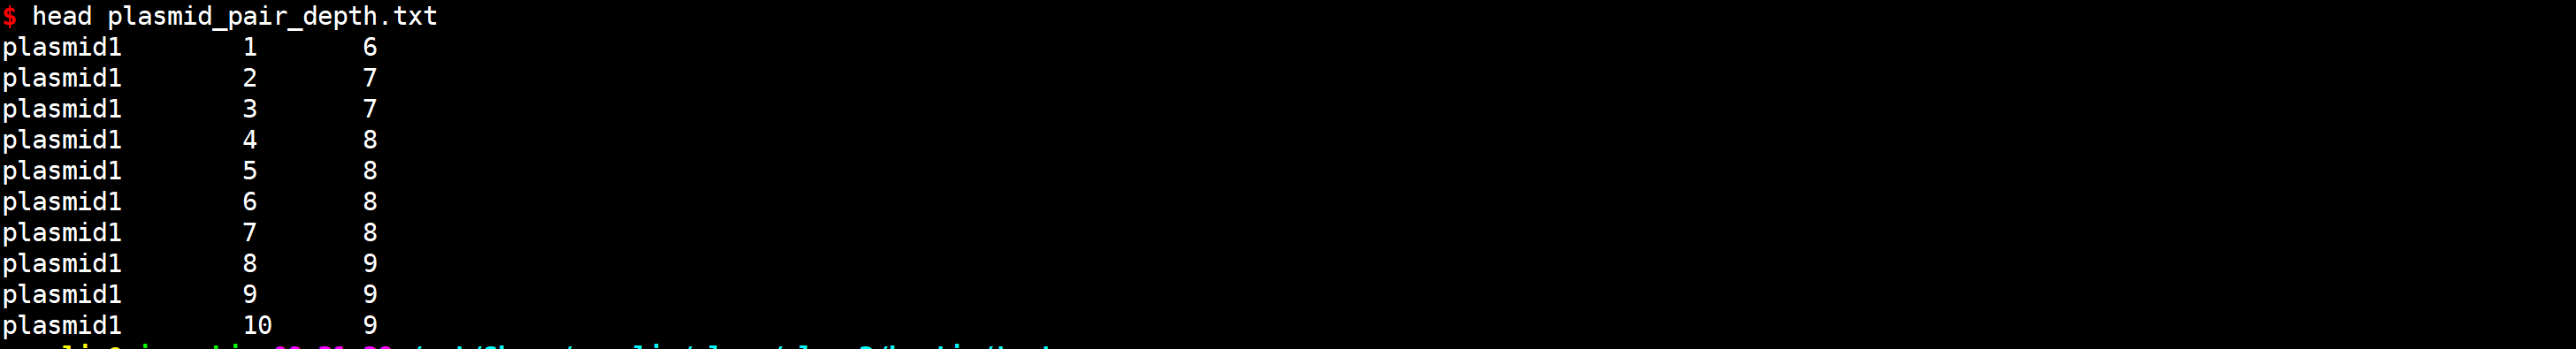
df <- read.table(“plasmid_pair_depth.txt”,header = F)
head(df)
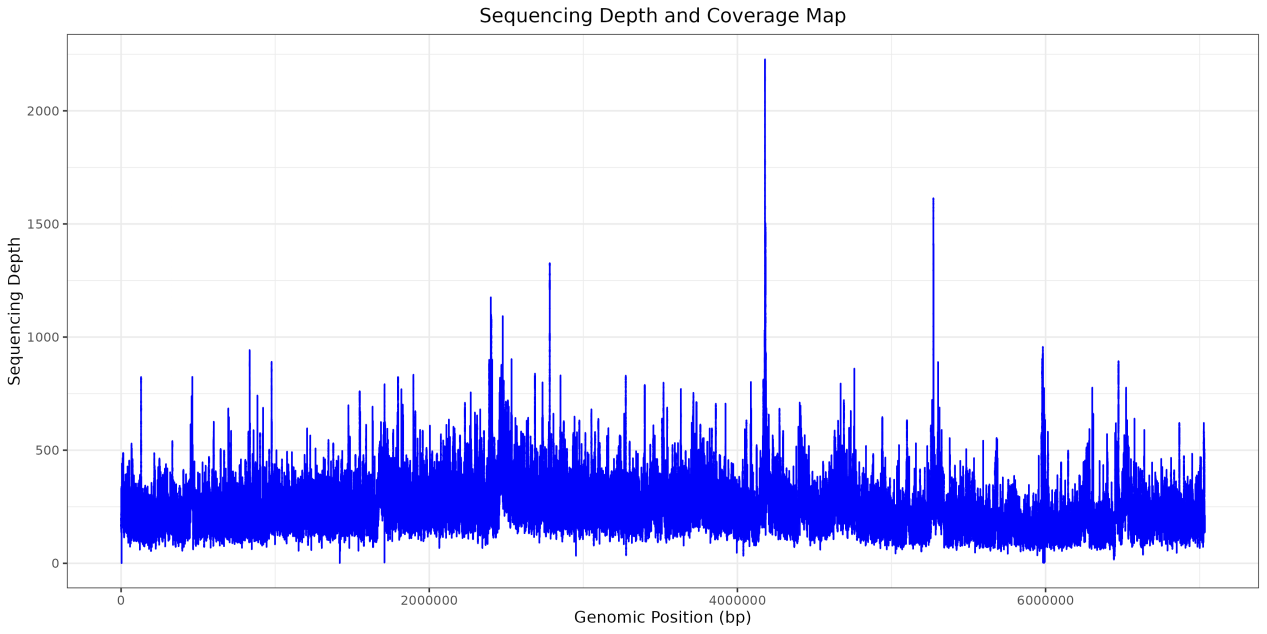
#绘制折线图
p1 <- ggplot(df,aes(x,y))+
geom_line(color = "#0002FA")+
labs(title = "Sequencing Depth and Coverage Map", # 设置标题文本
x = "Genomic Position (bp)", # 设置x轴标签文本
y = "Sequencing Depth")+ # 设置y轴标签文本
theme(plot.title = element_text(hjust = 0.5),
axis.text.x = element_text(hjust = 0.5)) # 将x轴标签居中显示
p1
我们将持续分享微生物组学研究和生信分析相关的专业技能资料。推荐课程请搜索“密码子学院”。课程问题或个性化分析需求,请联系小唯(微信号:winnerbio01)。
https://wap.sciencenet.cn/blog-3447233-1495483.html
上一篇:Bowtie2软件的安装和使用
下一篇:使用SAMtools软件进行序列可视化展示