博文
信号的频域分析——傅里叶变换
|
Frequency-domain analysis is a tool of utmost importance in signal processing applications. While time-domain analysis shows how a signal changes over time, frequency-domain analysis shows how the signal's energy is distributed over a range of frequencies.
A signal can be converted between the time and frequency domains with a pair of mathematical operators called a transform. An example is the Fourier transform, which decomposes a function into the sum of a (potentially infinite) number of sine wave frequency components. The 'spectrum' of frequency components is the frequency domain representation of the signal.
The frequency-domain analysis by Fourier Transform can be done by fft function in MATLAB.
A full MATLAB code to do the FFT transform is attached:
%************ Load Data ******************************************
load waveform.txt,'-ascii';
Fs=1/0.01; %Sample rate is 1 sample every 0.01 second
y=waveform(:,2);
%************ Fast Fourier Transform ****************************
NFFT=length(y); % Number of FFT points
F=(0:1/NFFT:1/2-1/NFFT)*Fs; % Frequency vector
Y=fft(y,NFFT);
Y(1)=0; % remove the DC component for better visualization
A=abs(Y(1:NFFT/2)); % Magnitude of signal at each frequency
plot(F,A);
%************ Export Data ****************************************
fileD=fopen('waveform_f domain.txt','w');
D=[F' A];
fprintf(fileD,'%et%en',D');
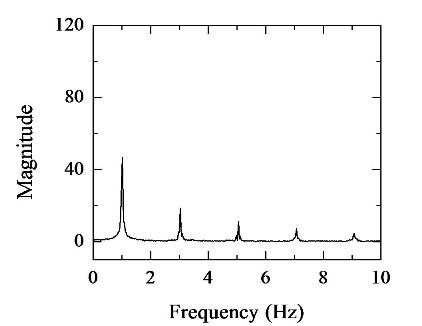
Results:


Time Domain Frequency Domain

The intervals Δω and Δt represent the resolution, or "graininess" of the responses, and represent a kind of uncertainty principle. The frequency interval Δω/2π Hz is equal to 1/NΔt, the reciprocal of the total sample time. This can be interpreted as follows: frequency can be determined by counting zero-crossings, each corresponding to a half-cycle. Suppose that in a one-second interval there are 6 zero-crossings. Depending on the phase of the signal at the start and finish, this could be produced by any frequency between 2.5 and 3.5 Hz. If a two-second interval, there would be 12 zero-crossings, which could be produced by any frequency between 2.75 and 3.25 Hz. So there is always an uncertainty in frequency equal to the reciprocal of the total time sample length.
Frequency resolution can be improved to whatever degree is desired by zero padding, appending a string of zeros to the time domain sequence to increase the total sample time. The cost is increased data processing.
https://wap.sciencenet.cn/blog-756363-729359.html
上一篇:Silicon wafer cleaning recipe
下一篇:Numerical integration/Gauss-Legendre Quadradure by MATLAB