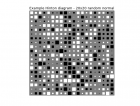
Hinton diagrams provide a qualitative display of the values in a data matrix/vector. The area occupied by a square is proportional to a value's magnitude, and the color (black or white in this case) indicates its sign (positive/negative). Hinton图的一个例子如下图所示: 生成上图的Python代码为 ...
@INPROCEEDINGS{XXQS+12, author = {Shuo Xu and Lijun Zhu and Xiaodong Qiao and Qingwei Shi and Jie Gui}, title = {Topic Linkages between Papers and Patents}, booktitle = {Proceedings of the 4th International Conference on Advanced Science and Technology}, year = { ...
今天发现原来发布的 LDA 、 AT 和 ToT 的Gibbs采样算法中有几个公式推导有点问题,不过最后的公式是正确的,不会影响大家写程序 现已纠正,并统一进行发布如下: Gibbs for LDA, ToT AT.pdf 对相关人员的理解造成不良影响的,在此一并表示歉意,希望这个新的版本对大家更有帮助。