博文
图形化处理软件P4VASP学习2
|||
关注:
1) DOS的画法
2) DOS的计算过程及结果文件中数据解读
3) 各种方法
xmgrace
p4vasp
python
需解决问题:
1) 采取p4vasp绘制能带图与态密度图不能匹配上,此时建议采用下面网址中提到的原始方法
http://blog.sciencenet.cn/blog-567091-675253.html
2) dos、band中是否已扣除E-fermi需进一步核实
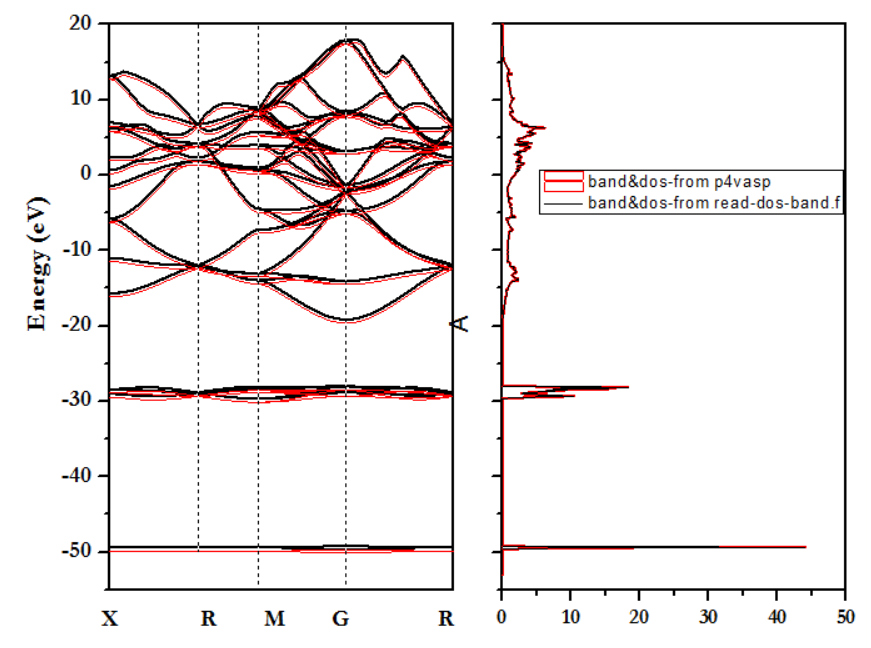
答:1) 经证实,采用p4vasp绘制的能带-态密度图与小脚本read-dos-band(费米能级采用的是scf中的)得到的保持一致,如下图所示。不一致的产生可能是操作失误。
2) p4vasp绘制的能带图中已自动扣除费米能级(费米能级采用的是dos、band-vasprum.xml中的),及费米能级自动设置为0.
Calculation
In order to visualize the band structure in p4vasp, you will need to perform a corresponding calculation with VASP. There are several details that need to be considered:
Use relaxed geometry.
Precalculate the charge density.
Inspect DOS with full k-points mesh.
Inspect band structure with selected strips of k-points.
Consider the right method for projecting wave functions if you want projected DOS and band structure.
Please consult VASP manual for more details, especially section Accurate DOS and Band-structure calculations.
Example for this article can be found in Download/Examples: vasprun_ldos.xml.
Loading and 3D View
Visulaization will be explained on a PbTiO3 system. The vasprun.xml file you can download here.
Start p4vasp and open the file (select Open in toolbox or File/Load system from menu).
After the file is opened, you should see PbTiO3 in the System selection in the upper part of the p4vasp window.
You can show the 3d structure by pressing Show and adjust the view in Control.
DOS and Band structure
Select DOS+bands from the toolbar (or alternatively from menu Electronic/DOS + bands):![]()
This will open a graph showing the density of states (DOS):
Waring about DOS: DOS is calculated from the k-points specified. DOS stemming from a strip of k-points will highly probable look differently from a DOS from a complete k-point mesh. Thus if you want to show DOS and band-structure, you will likely need to combine two different calculations.
In all DOS/bandstructure graphs is the energy relative to the Fermi energy - i.e. the Fermi energy on the graph is zero.
You can change between different modes (DOS / bandstructure) in graph menu Show:
show DOS turns showing DOS on and off. This is mainly useful for projected DOS.
DOS: Shows the density of states. (Energy on x-axis, DOS on y-axis.
DOS (X-axis): Shows the density of states. (Axes are switched, i.e. DOS on x-axis, energy on y-axis).
Bands: Shows the band structure.
DOS and Bands: Shows DOS and band structure side by side.
Local DOS and band structure
Calculation of local projections of DOS and band structure depends on VASP settings. Please consult the VASP manual.
Selecting Electronic/Local DOS+bands control from the menu will open a form, where you can add projected DOS and band structure to the graph:
This form controls display of both projected DOS and projected band structutre. It allows to select and sum up projections on different atoms, orbitals and spin projections.
In order to add a new projection do the following:
Selecting atoms(s). You can do this by either pointing to atoms in 3d view and pressing space or by a selection language - e.g. "Pb" will select all lead atoms. Contributions on all selected atoms will be summed together.
(optional) Write description label, that will appear in the graph legend. If not specified, it will be filled automatically.
(optional) You can specify symbol color, type and size to be used for projected band structure.
Spin projection (only relevant if spin has been calculated).
Orbital projection: use checkboxes, select and deselect buttons to select desired spherical harmonics projections (orbitals). Press Select all to sum up all orbital projections. Contributions on all selected spherical harmonics projections will be summed together.
Press Add new line.
Note, that graph will show DOS and/or band structure depending on what was selected in Show menu.
在DOS图左上角有个graph,点这个选择export| 导出你需要的格式。一般我不会直接用它生成的图,我都是导成data格式,然后再origin或其他专业画图软件中画图。
p4vasp 选择原子的语法


Atom selections are needed in several situations: in the Structure viewer for showing/hiding atoms, for geometry manipulation and in the projected DOS and band structure.
The easiest way to select/unselect atoms is to point to an atom in Structure viewer and press space.
This will select/unselect the atom under the mouse arrow.Selected atoms are in the 3d view marked by black spirals around the atom spheres. Each selection can be represented by a selection statement. As you select/unselect atoms in the Sructure viewer, the selection statement is updated and it is shown in the Selection field:
The selection statement uses a simple mini-language for definig groups of atoms..
Selection language by example:
Ca - shows all calcium atoms. Warning: the case matters, thus ca or CA will not work.
2 - select the second atom in the structure.【选择结构中的第二个原子】
2-5 - select the atoms in the range from second to fifth (i.e. 2,3,4,5). 【选择结构中从第二个到第五个原子】
2- -select every atom from the second one (2,3,4,5,6,...). 【选择第二个原子及其后的所有原子】
-5 -select every atom up to the fifth (1,2,3,4,5). 【选择到第五个原子】
all - select all atoms. 【选择所有原子】
#1 - select all atoms of the 1st specie. 【选择第一种元素的所有原子】
Ca:1 - select the first calcium atom (terms like Ca:2-5,Ca:2-,Ca:-5 are also legal).
【选择第一个Ca原子】
#2:1 - select the first atom of the second specie (terms like #2:2-5, #2:2-, #2:-5 work as well).
【选择第二种原子的第一个原子】
C:3- Sc - select all carbon atoms starting from the third, and all scandium atoms. Terms can be joined together (separated by one or more spaces).【选择从第三个开始的所有碳原子核所有Sc原子】
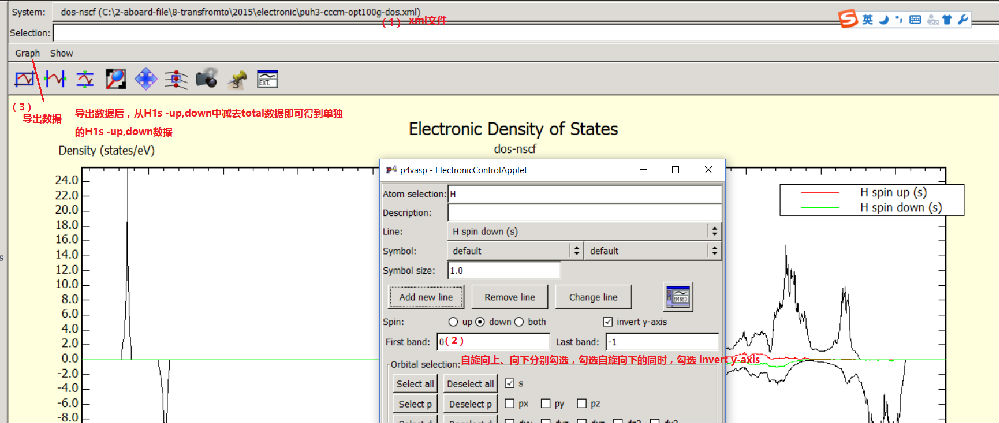
如何画自旋向上和向下的局域态密度 ,
选择electronic 菜单中Local DOS +band control选项,输入考察的元素符号,例如先选d电子的spin up,点击add new line得spin up态密度,再选spin down ,同时勾选invert y axis,点击add new line,得d电子的spin down态密度;一次类推
能带结构:需用计算能带时产生的xml文件处理。
https://wap.sciencenet.cn/blog-567091-736149.html
上一篇:计算结果的图形化处理-从p4vasp谈起
下一篇:Useful tools for VASP users
全部作者的其他最新博文
全部精选博文导读
相关博文
- • Minerals线下恳谈会:履践致远、与时偕行——对话中国科学院广州地球化学研究所期刊合作学者
- • 聚英才 建高地 | 北京理工大学“特立青年学者”全球招聘开启
- • 700年后日本或濒临灭绝?日本学者推算预测:届时或仅剩1名15岁以下孩子
- • [转载]【同位素视角】非英语母语学者如何区分’e.g.’, ‘i.e.’, ‘namely’与‘such as’等混淆难题
- • 美国佐治亚大学等机构学者:刈割策略对Bulldog 805紫花苜蓿+Tifton 85狗牙根混播草地产量及品质的影响
- • 美国堪萨斯州立大学、密苏里大学等机构学者研究成果:土壤水分管理策略和品种多样性对紫花苜蓿产量、营养品质和农场盈利能力的影