博文
[转载]330.有多少人死于流感?
|||
有多少人死于流感?
随着时间的推移,死于流感的风险已经下降,但在全球范围内,每年仍有数十万人死于该疾病。
Saloni Dattani and Fiona Spooner
2022年10月20日
在全球范围内,每年有数十万人死于季节性流感。在大规模流感大流行期间,当流感毒株大幅进化时,死亡人数甚至会更高。
但随着时间的推移,由于卫生、医疗和疫苗接种的改善,死于流感的风险已经大幅下降。
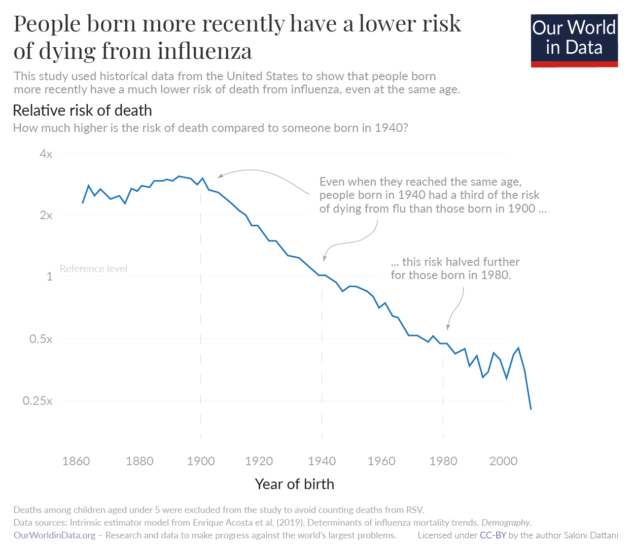
1940年出生的人死于流感的风险大约是1900年出生的人的三分之一,即使他们达到了相同的年龄。这种下降趋势还在继续,1980年出生的人患病风险是1940年出生的人的一半。
由于人口老龄化和许多国家缺乏医疗保健和卫生设施,流感仍然是世界各地的一大负担。
在这篇文章中,我们详细研究了这些进展:有多少人死于季节性流感,以及随着时间的推移这种情况是如何变化的。
我们还将研究哪些因素会增加死于流感的风险,并理解为什么在某些年份,流感会导致大规模流行病,导致数百万人死亡。这些知识可以告诉我们未来流感的风险。
有多少人死于季节性流感?
虽然这是一个重要的问题,但通常很难回答。
尽管流感是一种广为人知的疾病,但由于几个原因,很难统计流感死亡人数。1
一个问题是,流感的症状看起来与其他感染相似,如呼吸道合胞病毒和鼻病毒。在许多国家,只有一小部分“流感样疾病”患者接受检测,以确认他们是否被病毒感染。2这意味着我们错过了许多——或者在一些国家,错过了大部分——感染。
另一个问题是流感会以多种间接方式导致死亡。它可以通过肺炎等呼吸道并发症导致死亡,也可以通过心脏病发作和中风等心血管并发症或其他严重感染导致死亡。对于老年人和有慢性健康问题的人来说尤其如此。3如果不考虑这些死亡人数,我们会低估流感死亡人数。
为了克服这一点,研究人员用其他方法来估计流感的负担。他们可以估计出过量的流感季节发生的死亡,并使用常规监测数据和死亡记录,来估计其中有多少是由流感引起的。
季节性流感导致的年死亡率由全球疫情死亡率项目II使用2002年至2011年的数据。他们估计,在此期间,季节性流感每年在全球造成294,000至518,000人死亡。4
这些估计集中在患有呼吸系统疾病的死亡人数上。这意味着他们遗漏了一些流感死亡病例,因为一些人可能死于流感的心血管并发症,而没有呼吸道疾病。
在地图上,您可以看到65岁以上人群中流感死亡率的估计值,以每100,000人的比率显示。
在欧洲,在65岁以上的人群中,每年死于流感的人数为十万分之30.8。这是交通事故风险的三倍多,在同一年龄组中,交通事故的死亡率为十万分之九。5
在低收入国家,这些估计往往不太确定,因为流感检测水平较低,死亡率记录有限。
但是据估计,流感在南美、非洲和南亚国家比在欧洲和北美更致命。例如,印度尼西亚的死亡率是加拿大的两倍多。这些差异至少部分是由于贫困、较差的基础健康和较低的医疗保健可及性。
过去流感死亡率是什么样的?
流感死亡率比过去低得多。
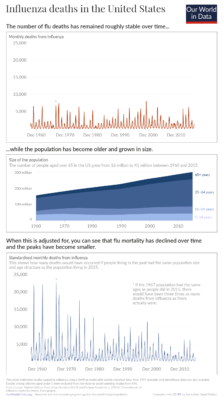
我们没有对大多数国家流感死亡人数的良好长期估计。但是,研究人员已经对美国长期流感死亡人数进行了每周评估。这让我们可以看到现代汇率与过去的对比。你可以在图表中看到这些数据。6
流感死亡人数全年波动,冬季达到高峰。7这总数在过去的65年里,美国死于流感的人数大致稳定。你可以在图表的顶部看到这一点。
然而,这很大一部分是因为人口一直在增长和老龄化。
如果我们看看死亡率在…之内年龄组中,流感死亡率一直在下降。你可以在底部面板中看到这一点,这说明了人口规模和年龄结构的变化。
这意味着有人死于流感的可能性在给定的年龄随着时间的推移已经下降。但是,由于人口越来越多,年龄越来越大,死亡总数保持稳定。
为什么流感死亡率会随着时间的推移而下降?
几代人以来,流感死亡率一直在下降。我们从美国的历史数据中了解到这一点,这些数据被用来估计“群体效应”。这告诉我们,在考虑了年龄较小的因素后,越晚出生的人死亡的风险是否越低。
自1900年以来,死于流感的风险长期下降。8这有几个原因。
一个是在20世纪早期,美国各地都有改善城市卫生的大型项目。9在二十世纪,新生儿保健也有所改善,新生儿死亡率也有所上升儿童疫苗。所有这些因素都有随着年龄增长而延续的益处:它们保护人们免于发展增加死于流感风险的共病。
流感疫苗接种率也有所上升。20世纪30年代和40年代首次开发出流感疫苗。1952年,世界卫生组织启动了一个监测系统,以监测哪些流感病毒株在全球范围内传播。这有助于研究人员每年开发与这些毒株相匹配的新疫苗。10在接下来的几十年里,老年人流感疫苗接种率开始成长。11
从图表中可以看出,流感死亡率的历史下降幅度很大。
即使到了相同的年龄,1940年出生的人死于流感的风险也只有1900年出生的人的三分之一左右。这种下降趋势仍在继续,1980年出生的人患病风险是1940年出生的人的一半。12
哪些因素影响流感死亡人数?
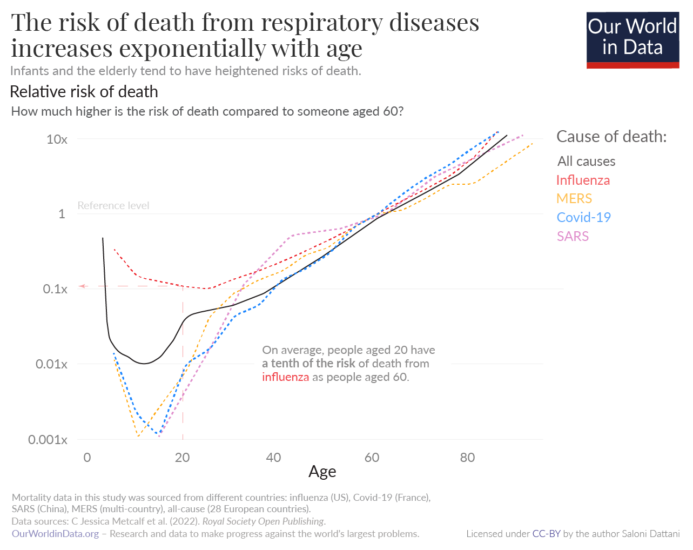
年龄是死于流感的主要风险因素。如图所示,与年轻人相比,婴儿和老年人死于包括流感在内的一系列呼吸系统疾病的风险更高。例如,60岁的人死于流感的风险是20岁的人的十倍。13
一旦有人到了20多岁,他们死于流感的风险就会成倍增加。这种形状遵循各种原因的死亡风险。14
死于流感的风险还取决于其他因素,如医疗质量、流感毒株以及患者是否接种了流感疫苗。15
每年,流感疫苗都被重新配制,以匹配预计在冬季占主导地位的流感病毒株。当疫苗中的毒株与正在传播的流感毒株不匹配时,疫苗的效力往往会降低,流感季节往往会更加严重。16
为什么有些流感季节如此严重?
有些季节比通常的季节性流感严重得多。当新的流感病毒株出现并导致流感大流行时,这往往会发生。
随着时间的推移,在人群中传播的流感病毒往往会通过一种称为“抗原漂移”的过程发生变异。这使他们有能力逃避人们的免疫。
但是,流感病毒也可以随着巨大而突然的变化而进化。这发生在一个被称为“抗原转换”的过程中,即不同毒株的部分相互结合。这些新的组合可能比以前的毒株更具传染性和致命性,导致更致命的大流行。
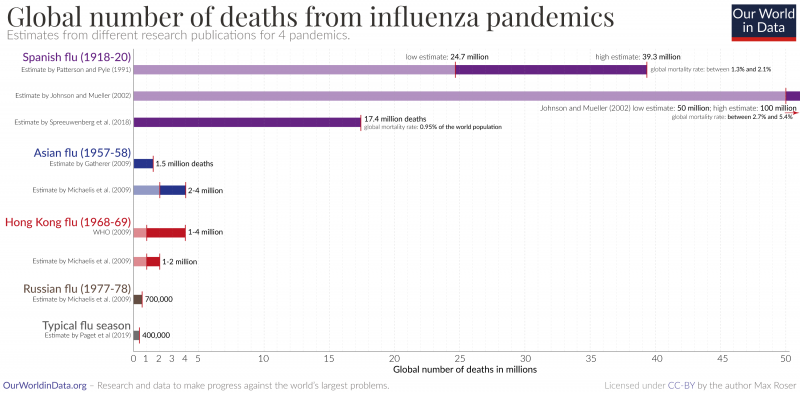
例如,西班牙流感是由人类流感和另一种动物流感结合而成的,形成了一种新的H1N1流感病毒。正如你在图表中看到的,它导致了史上最大规模的疫情流感字体最近的研究估计,在1918年到1920年间,全世界有1740万人死于西班牙流感。17
这一死亡人数大大超过了典型年份死于流感的人数——比估计的每年294,000到518,000例季节性流感死亡人数高出30到60倍,尽管当时全球人口要少得多。18
与前几个季节相比,西班牙流感期间年轻人的死亡率大幅上升。研究表明,这是因为他们对H1流感病毒缺乏免疫力,因为他们在童年时期接触过不同的流感病毒株。相比之下,老一代人在疫情开始前几十年就已经接触过类似的H1流感病毒,这使他们在一定程度上免受H1N1疫情病毒的感染。19
结论
每年有数十万人死于季节性流感。但由于卫生、医疗和疫苗接种的改善,负担远低于过去。
流感仍然是全世界的一大负担,原因有二。一是世界上许多人仍然缺乏医疗保健,流感疫苗接种率低,这增加了死亡风险。
另一个原因是许多国家的人口正在迅速老龄化。在低收入国家,流感可能成为他们面临的更大负担未来的老龄化人口.
为了应对这一风险,世界可以从过去如何减轻负担中吸取教训。一种方法是增加流感疫苗接种率,以及其他常规疫苗接种,这也降低了流感严重的风险。另一个目标是改善世界各地的卫生条件和医疗服务。
几十年来,我们已经看到流感的负担大幅下降,通过更大的努力,我们可以看到负担进一步下降。
https://ourworldindata.org/influenza-deaths
Endnotes
Gordon, A., & Reingold, A. (2018). The Burden of Influenza: A Complex Problem. Current Epidemiology Reports, 5(1), 1–9. https://doi.org/10.1007/s40471-018-0136-1
Charbonneau, D. H., & James, L. N. (2019). FluView and FluNet: Tools for Influenza Activity and Surveillance. Medical Reference Services Quarterly, 38(4), 358–368. https://doi.org/10.1080/02763869.2019.1657734
Macias, A. E., McElhaney, J. E., Chaves, S. S., Nealon, J., Nunes, M. C., Samson, S. I., Seet, B. T., Weinke, T., & Yu, H. (2021). The disease burden of influenza beyond respiratory illness. Vaccine, 39, A6–A14. https://doi.org/10.1016/j.vaccine.2020.09.048
Paget J, Spreeuwenberg P, Charu V, Taylor RJ, Iuliano AD, Bresee J, Simonsen L, Viboud C; Global Seasonal Influenza-associated Mortality Collaborator Network and GLaMOR Collaborating Teams*. Global mortality associated with seasonal influenza epidemics: New burden estimates and predictors from the GLaMOR Project. J Glob Health. 2019 Dec;9(2):020421. doi: 10.7189/jogh.09.020421. https://jogh.org/documents/issue201902/jogh-09-020421.pdf
This shows the mean estimate of annual influenza mortality between 2002–2011, excluding the 2009 “Swine flu” pandemic influenza season. You can find estimated numbers for world regions in Table 2 of the paper. Rates for other age groups can be found here: https://www.nivel.nl/sites/default/files/influenza-nieuwsbrief/GLaMOR%20project_seasonal%20estimates.pdf
Other global estimates of seasonal influenza mortality have been made by the Institute of Health Metrics and Evaluation (IHME) and the Centers for Disease Control and Prevention (CDC).
Estimates made by GLaMOR were comparable to those by the CDC, while estimates made by IHME were around 4-5 times lower. This may be because the IHME estimated influenza mortality by first estimating the number of deaths caused by lower respiratory diseases, then estimating the fraction of those that were primarily attributed to influenza in vital records, verbal autopsies, and other mortality data. This approach would have missed many deaths caused by complications of influenza and deaths that were not specified on records to be caused by influenza due to limited testing.
Both CDC and GLaMOR’s models are also likely to be underestimating the total mortality burden from influenza, as they only use data from respiratory-associated deaths. While this would include deaths caused by influenza that had, for example, influenza listed as a secondary cause of death on death certificates, it would miss some that were caused by influenza but attributed to another cause like cardiovascular disease. Had these models used all-cause mortality to estimate deaths caused by influenza, they would have been more sensitive (captured more deaths caused by influenza) but also less specific (captured more deaths caused by other diseases that could not be distinguished easily).
In comparison to CDC estimates, GLaMOR used many country-specific indicators in order to extrapolate seasonal influenza mortality to countries that did not provide weekly or monthly influenza mortality records or influenza surveillance data, while the CDC extrapolated this using mainly the WHO Global Health Estimates of respiratory mortality.
Eurostat. (2022). Causes of death—Standardised death rate. European Commission. https://ec.europa.eu/eurostat/databrowser/view/HLTH_CD_ASDR2__custom_3500876/default/table?lang=en
Transport accidents are counted under (V01–V99, Y85) in the ICD-10. Across 27 EU countries, these rates were 9.02, 9.15, and 8.77 per 100,000 people aged over 65 in 2015, 2016 and 2017 respectively.
Estimates of the rate of death from influenza are much lower in the ICD-10 since they only consider deaths where influenza is listed as the cause of death on death certificates, while the estimates we show above also include those that are caused by flu indirectly. This means ICD-10 death rates are likely to be highly underestimated for the flu. However, deaths caused by traffic accidents are more likely to be listed as the primary cause of death on death certificates and are much less underestimated by death certificate data.
Acosta, E., Hallman, S. A., Dillon, L. Y., Ouellette, N., Bourbeau, R., Herring, D. A., Inwood, K., Earn, D. J. D., Madrenas, J., Miller, M. S., & Gagnon, A. (2019). Determinants of Influenza Mortality Trends: Age-Period-Cohort Analysis of Influenza Mortality in the United States, 1959–2016. Demography, 56(5), 1723–1746. https://doi.org/10.1007/s13524-019-00809-y
From 1960 to 2015, the number of deaths from influenza was estimated using a Serfling model, which estimates the excess number of deaths during flu seasons using data from the rest of the year and accounting for changes that occur year by year. Since 1997, there has also been routine testing for “influenza-like illnesses” in hospitals to determine the share of them that are actually caused by influenza, rather than other diseases. Therefore, estimates from 1997 to 2015 were also calculated using a Serfling-surveillance model, which accounted for the share of tests that were positive for influenza. This also validates the estimates from the regular Serfling model. In addition, deaths among children aged under 5 are excluded in both models, as they would be likely to include deaths from respiratory syncytial virus.
Mortality in the US was slightly lower in during the 2009 Swine flu pandemic season than usual flu seasons, as severe disease shifted away from the elderly to young and middle-aged adults. However, the 2009 Swine flu pandemic led to more deaths than regular flu seasons in other countries such as Mexico.
Gagnon, A., Acosta, E., Hallman, S., Bourbeau, R., Dillon, L. Y., Ouellette, N., Earn, D. J. D., Herring, D. A., Inwood, K., Madrenas, J., & Miller, M. S. (2018). Pandemic Paradox: Early Life H2N2 Pandemic Influenza Infection Enhanced Susceptibility to Death during the 2009 H1N1 Pandemic. MBio, 9(1), e02091-17. https://doi.org/10.1128/mBio.02091-17
Influenza viruses are thought to transmit more efficiently during the winter due to lower temperatures and humidity. But in many tropical countries, flu epidemics coincide with warm rainy seasons, so the trends may have more causes. Other explanations include seasonal changes in human immunity or changes in human behavior, such as more indoor mixing and crowding. Petrova, V. N., & Russell, C. A. (2018). The evolution of seasonal influenza viruses. Nature Reviews Microbiology, 16(1), 47–60. https://doi.org/10.1038/nrmicro.2017.118
Between 1860 and 1900, there was a slight increase in the risk of death from influenza, which may have been due to worsening health conditions as more people moved into crowded urban areas.
Acosta, E., Hallman, S. A., Dillon, L. Y., Ouellette, N., Bourbeau, R., Herring, D. A., Inwood, K., Earn, D. J. D., Madrenas, J., Miller, M. S., & Gagnon, A. (2019). Determinants of Influenza Mortality Trends: Age-Period-Cohort Analysis of Influenza Mortality in the United States, 1959–2016. Demography, 56(5), 1723–1746. https://doi.org/10.1007/s13524-019-00809-y
Cutler, D., & Miller, G. (2005). The role of public health improvements in health advances: The twentieth-century United States. Demography, 42(1), 1–22. https://doi.org/10.1353/dem.2005.0002
Barberis, I., Myles, P., Ault, S. K., Bragazzi, N. L., & Martini, M. (2016). History and evolution of influenza control through vaccination: From the first monovalent vaccine to universal vaccines. Journal of Preventive Medicine and Hygiene, 57(3), E115–E120. https://www.ncbi.nlm.nih.gov/pmc/articles/PMC5139605/
Centers for Disease Control and Prevention, & National Center for Immunization and Respiratory Diseases. (2021). Historical Reference of Seasonal Influenza Vaccine Doses Distributed. https://www.cdc.gov/flu/prevent/vaccine-supply-historical.htm
These estimates are more variable for young age groups, particularly those born after 1990 because the number of influenza deaths to make comparisons were low, especially as deaths in children under 5 were excluded from the models, to avoid counting deaths from respiratory syncytial virus.
Acosta, E., Hallman, S. A., Dillon, L. Y., Ouellette, N., Bourbeau, R., Herring, D. A., Inwood, K., Earn, D. J. D., Madrenas, J., Miller, M. S., & Gagnon, A. (2019). Determinants of Influenza Mortality Trends: Age-Period-Cohort Analysis of Influenza Mortality in the United States, 1959–2016. Demography, 56(5), 1723–1746. https://doi.org/10.1007/s13524-019-00809-y
Metcalf, C. J. E., Paireau, J., O’Driscoll, M., Pivette, M., Hubert, B., Pontais, I., Nickbakhsh, S., Cummings, D. A. T., Cauchemez, S., & Salje, H. (2022). Comparing the age and sex trajectories of SARS-CoV-2 morbidity and mortality with other respiratory pathogens. Royal Society Open Science, 9(6), 211498. https://doi.org/10.1098/rsos.211498
In this post, we show the relative risks of death. This is because it’s more difficult to give an absolute risk of death from influenza at different ages, because mortality rates vary widely over time and between countries, as we saw earlier. Absolute risks depend on how many people are infected during a flu season, the availability of healthcare, the rates of vaccination, and so on. However, the relative risk of death – ratio between the risk of death in one age group versus another – tends to be more consistent.
The shape of this age–mortality curve is often described by the Gompertz function. Olshansky, S. J., & Carnes, B. A. (1997). Ever since gompertz. Demography, 34(1), 1-15. https://link.springer.com/content/pdf/10.2307/2061656.pdf
Belongia, E. A., Simpson, M. D., King, J. P., Sundaram, M. E., Kelley, N. S., Osterholm, M. T., & McLean, H. Q. (2016). Variable influenza vaccine effectiveness by subtype: A systematic review and meta-analysis of test-negative design studies. The Lancet Infectious Diseases, 16(8), 942–951. https://doi.org/10.1016/S1473-3099(16)00129-8
Tricco, A. C., Chit, A., Soobiah, C., Hallett, D., Meier, G., Chen, M. H., Tashkandi, M., Bauch, C. T., & Loeb, M. (2013). Comparing influenza vaccine efficacy against mismatched and matched strains: A systematic review and meta-analysis. BMC Medicine, 11(1), 153. https://doi.org/10.1186/1741-7015-11-153
P. Spreeuwenberg; et al. (1 December 2018). “Reassessing the Global Mortality Burden of the 1918 Influenza Pandemic”. American Journal of Epidemiology. 187 (12): 2561–2567. doi:10.1093/aje/kwy191. PMID 30202996. Online here.
Paget J, Spreeuwenberg P, Charu V, Taylor RJ, Iuliano AD, Bresee J, Simonsen L, Viboud C; Global Seasonal Influenza-associated Mortality Collaborator Network and GLaMOR Collaborating Teams*. Global mortality associated with seasonal influenza epidemics: New burden estimates and predictors from the GLaMOR Project. J Glob Health. 2019 Dec;9(2):020421. doi: 10.7189/jogh.09.020421. https://pubmed.ncbi.nlm.nih.gov/31673337/
Worobey, M., Han, G.-Z., & Rambaut, A. (2014). Genesis and pathogenesis of the 1918 pandemic H1N1 influenza A virus. Proceedings of the National Academy of Sciences, 111(22), 8107–8112. https://doi.org/10.1073/pnas.1324197111
Gagnon, A., Miller, M. S., Hallman, S. A., Bourbeau, R., Herring, D. A., Earn, D. J. D., & Madrenas, J. (2013). Age-specific mortality during the 1918 influenza pandemic: Unravelling the mystery of high young adult mortality. PloS One, 8(8), e69586. https://doi.org/10.1371/journal.pone.0069586
Luk, J., Gross, P., & Thompson, W. W. (2001). Observations on Mortality during the 1918 Influenza Pandemic. Clinical Infectious Diseases, 33(8), 1375–1378. https://doi.org/10.1086/322662
https://wap.sciencenet.cn/blog-55647-1382385.html
上一篇:[转载]329.我们需要更多的测试来根除全世界的脊髓灰质炎
下一篇:[转载]331.蝙蝠与数十种讨厌的病毒共存——研究它们有助于阻止大流行吗?