博文
Matlab 自定义颜色表 colormap
||
%%%%% The code is developed to generate colormap with given colors.
%%%%% date: 2021 May 14
clear
clc
close all
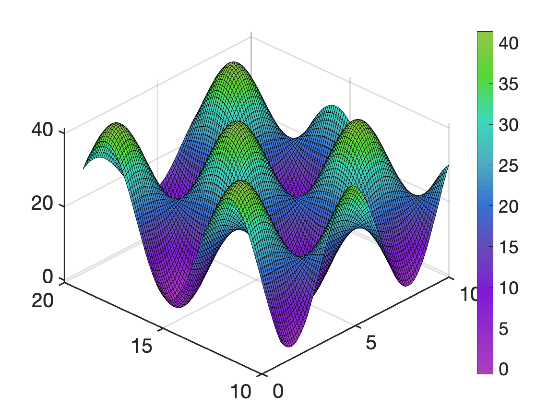
[X,Y] = meshgrid(1:0.1:10,10:0.1:20);
Z = (sin(X).*cos(Y)+0.97)*21;
surf(X,Y,Z); % plot a 3D figure
aa=[179 75 190;
128 52 212;
105 81 183;
53 117 211;
74 173 190;
51 213 186;
76 211 53;
144 194 70]/255; % 8 colors in RGB value
N0=10;
k=1;
new=zeros(60,3); % Array for colormap
%%%%%%% 2*N0 intermedia colors between color 1 and color 2.
for cnt=1:N0*2
new(k,1)=( aa(1,1)+(aa(2,1)-aa(1,1) )*cnt/(2*N0) );
new(k,2)=( aa(1,2)+(aa(2,2)-aa(1,2) )*cnt/(2*N0) );
new(k,3)=( aa(1,3)+(aa(2,3)-aa(1,3) )*cnt/(2*N0) );
k=k+1;
end
%%%%%%% N0 intermedia colors between each color
for cnt1=2:length(aa)-1
for cnt=1:N0
new(k,1)=( aa(cnt1,1)+(aa(cnt1+1,1)-aa(cnt1,1) )*cnt/(N0) );
new(k,2)=( aa(cnt1,2)+(aa(cnt1+1,2)-aa(cnt1,2) )*cnt/(N0) );
new(k,3)=( aa(cnt1,3)+(aa(cnt1+1,3)-aa(cnt1,3) )*cnt/(N0) );
k=k+1;
end
end
colormap(new) % using the new colormap to plot the 3D figure
colorbar % show the colorba
set(gca,'FontSize',20,'LineWidth',1.5);
https://wap.sciencenet.cn/blog-3474482-1286556.html
下一篇:Matlab 高斯拟合多个峰