博文
Python绘图函数add_subplot 、 subplots_adjust、imshow及画图流程和弹窗设置
||
add_subplot 、 subplots_adjust函数见:
https://blog.csdn.net/yl_best/article/details/86511599
画图流程及imshow展示:
https://www.cnblogs.com/dylancao/p/9993953.html
弹窗设置:
1.点Tools->preferences->IPython console->Graphics->Automatic

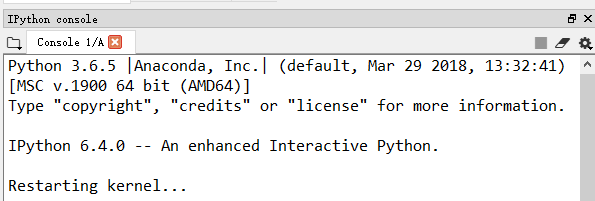
2.在console窗口中,右键,restart kernel

3.再次运行程序,发现图像就以弹窗的形式出现了

https://blog.csdn.net/leilei7407/article/details/104967438/
点滴分享,福泽你我!Add oil!
https://wap.sciencenet.cn/blog-3428464-1247930.html
上一篇:Python中*和**作用及随机数产生函数 np.random.rand()/numpy.random.unifo...
下一篇:感受野
扫一扫,分享此博文