博文
GEE -- API 基础(附文档)
||
GEE主要作为:
(1) a petabyte-scale archive of publicly available remotely sensed imagery and other data, 遥感数据云存储库
(2) a computational infrastructure optimized for parallel processing of geospatial data, 并行计算平台
(3) API application programming interfaces (APIs) for JavaScript and Python for making requests to the Earth Engine servers, and
(4) an online Integrated Development Environment (IDE) for rapid prototyping and visualization of complex spatial analyses using the Javascript API.
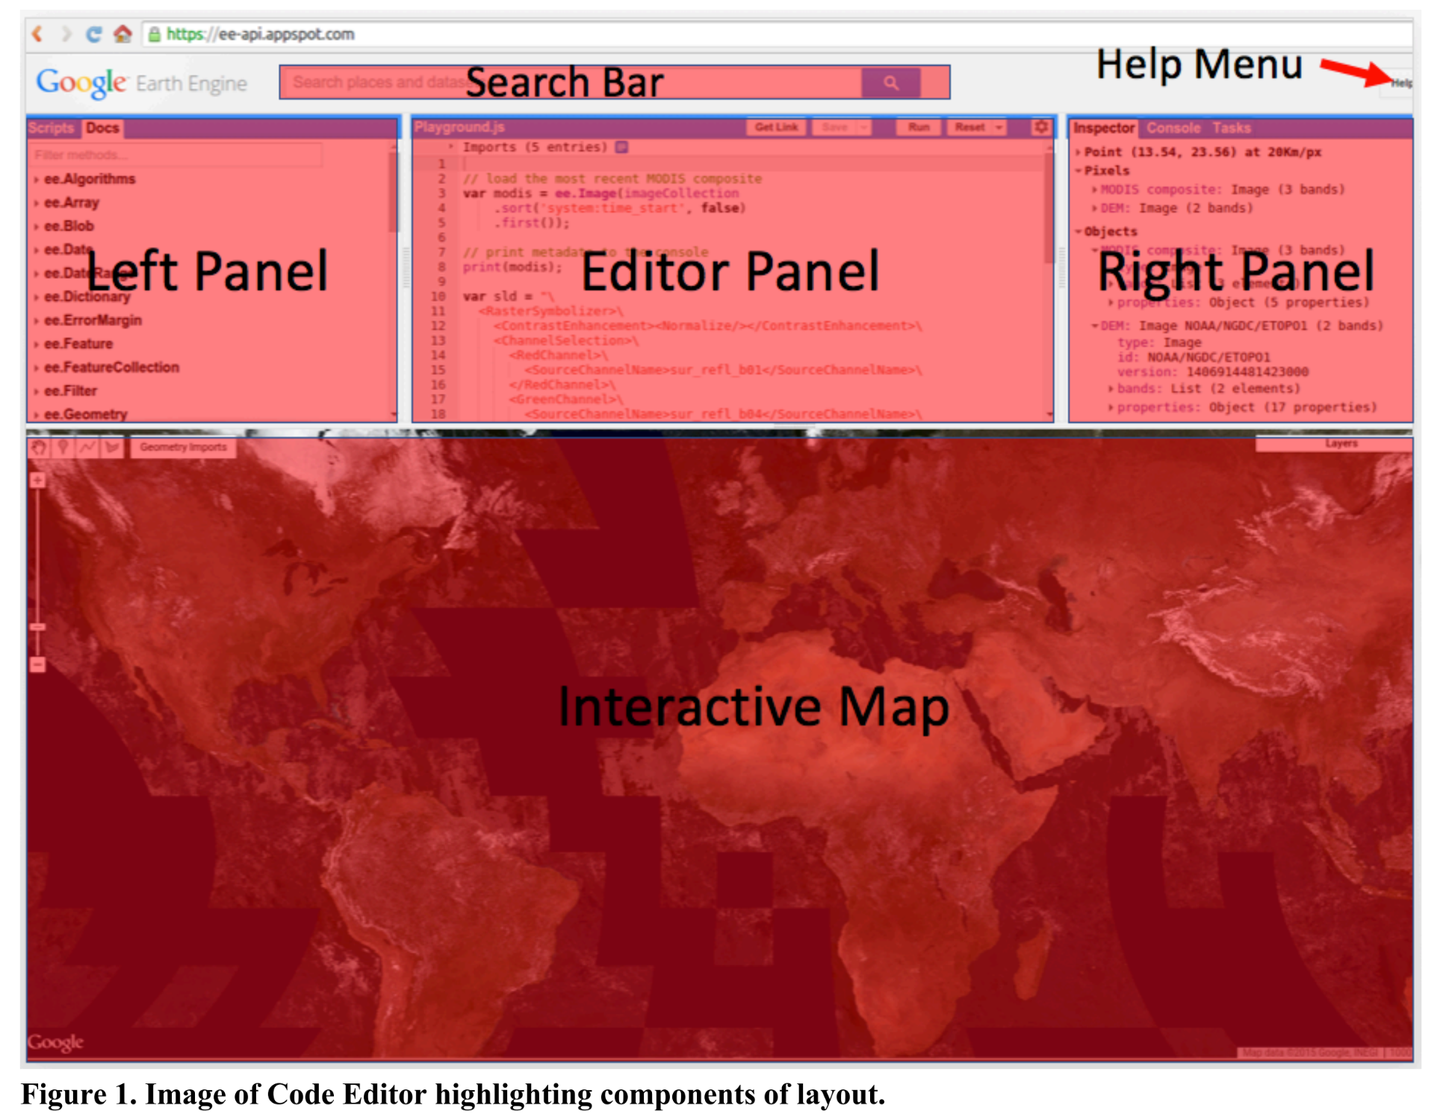
The code editor is a web-based IDE for the Earth Engine JavaScript API.主要在代码编辑器写代码

Programming in JavaScript
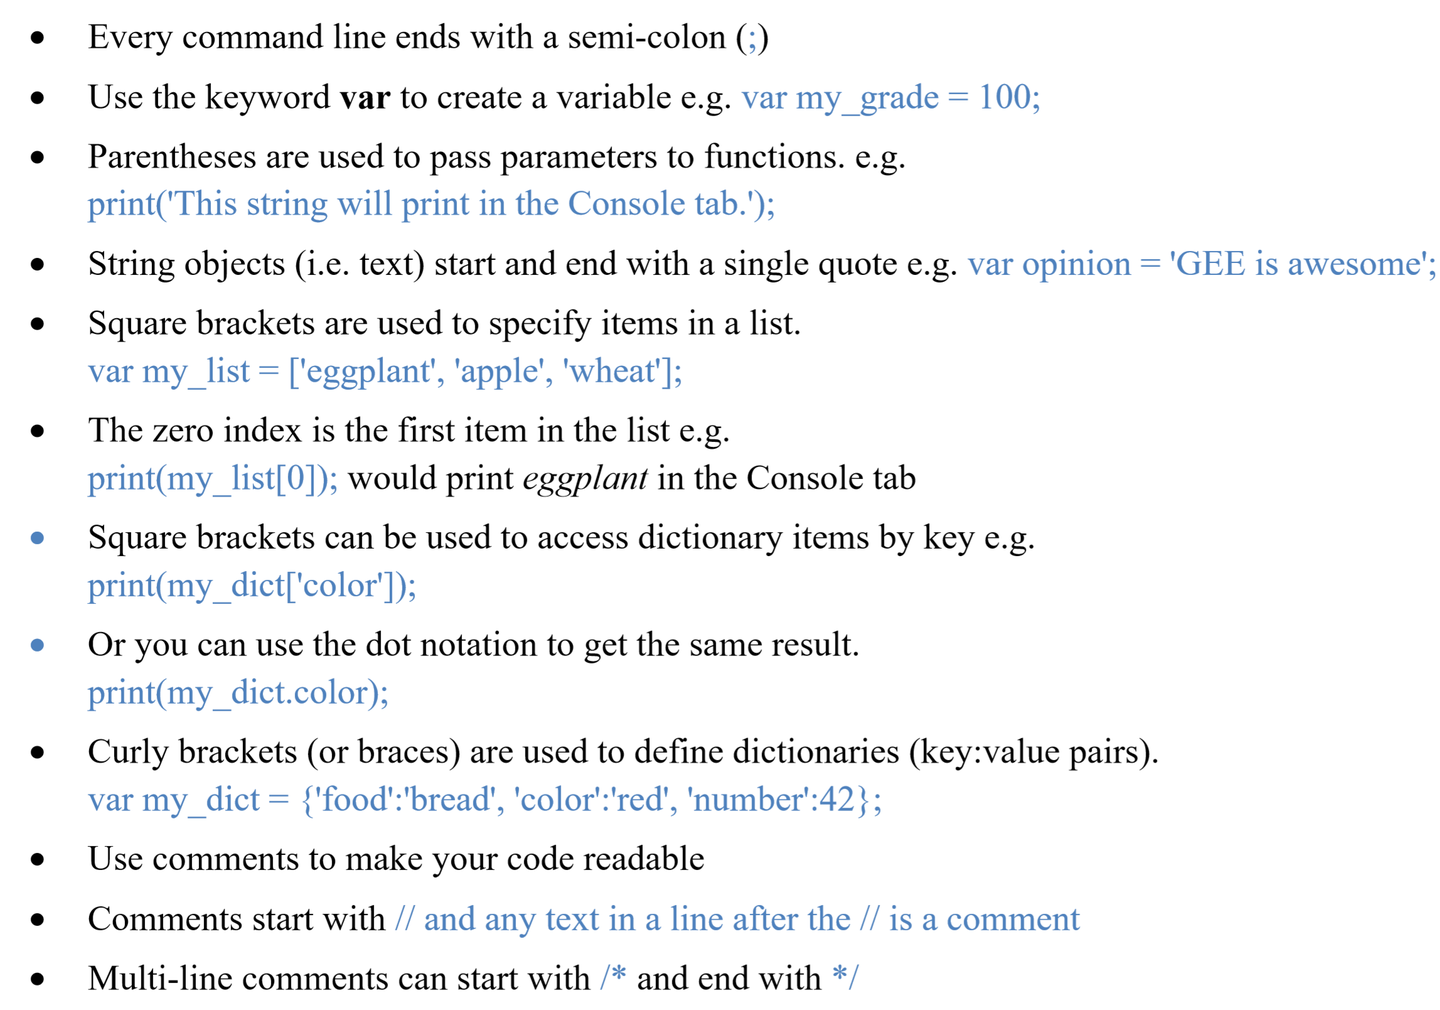
GEE builds upon JavaScript with modifications for use in the API interface.


Performing simple image visualization and analysis in GEE 进行简单操作
Displaying and clipping images and vectors 显示和裁剪图像和矢量
In GEE, ee.image is an object used to represent an Earth Engine image. In the script below, this is used to point to a particular Landsat 5 image that is stored in the variable called myimage.
// Create a variable that points to a particular Landsat image in the Earth Engine collection.
var myimage = ee.Image('LANDSAT/LT05/C01/T1_TOA/LT05_015030_20100531');
The Map.setCenter command sets the center of Interactive Map to a specified coordinates and controls the zoom level. A zoom level of 1in GEE would show the entire Earth, with larger numbers zooming in e.g. 5: Continent, 10: City, 15: Streets, 20: Buildings.
// Center the map and display the image.
// Center on City of Syracuse using level 10 scale Map.addLayer(myimage);
Map.setCenter(-76.147, 43.046, 10);
Map.addLayer(myimage);
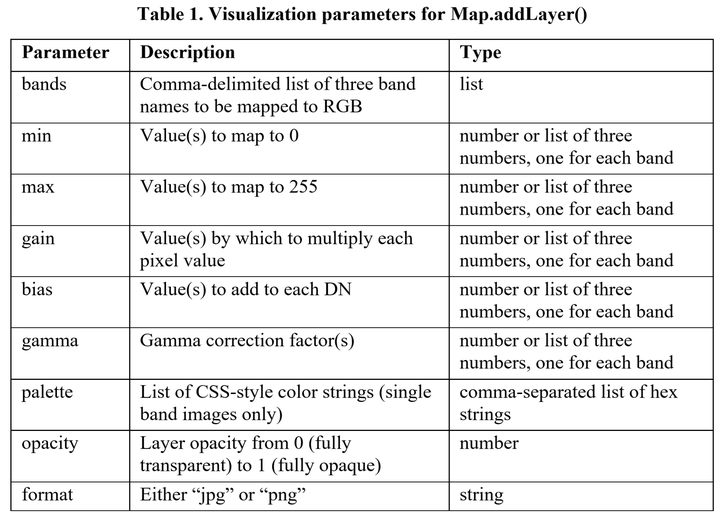
//map.addLayer(eeObject, visParams, name, shown, opacity); 按顺序来 in order
//Display the image using a specific band combination and call the image ColorIR composite.
Map.addLayer(myimage, {bands:['B4', 'B3', 'B2']}, 'ColorIR composite');
Map.addLayer({visParams: {bands:['B4', 'B3', 'B2']}, eeObject: myimage, name: 'ColorIR compo site2'});
//you can also create a variable to hold all the parameters:
// Define visualization parameters to display the image in the map window.
var vizParams = {
bands: ['B4', 'B3', 'B2'],
min: 0,
max: 0.5,
gamma: [0.95, 1.1, 1] };
Map.addLayer(image, vizParams, 'Color IR composite3');

使用ROI(兴趣区)展示部分影像:
// Create a variable that points to a particular Landsat image in the Earth Engine collection.
var myimage = ee.Image('LANDSAT/LT05/C01/T1_TOA/LT05_015030_20100531');
// Center the map and display the image.
// Center on City of Syracuse using level 10 scale Map.addLayer(myimage);
Map.setCenter(-76.147, 43.046, 10);
var vizParams = {
bands: ['B4', 'B3', 'B2'],
min: 0,
max: 0.5,
gamma: [0.95, 1.1, 1] };
Map.addLayer(myimage, vizParams, 'Color IR composite');
// Create a circle by drawing a 2000 meter buffer around a point and saving this to variable roi. '
var roi = ee.Geometry.Point([-76.147, 43.046]).buffer(20000);
// Display the 2000 meter buffer.
Map.addLayer(roi);
// Display a clipped version of the image.
Map.addLayer(myimage.clip(roi),vizParams, 'Clip Color IR composite');


Exploring image collections and their metadata 影像集和元数据
之前是单张影像的显示与裁剪,但是在实际处理中一般需要对长时间序列的影像集合进行处理
An ImageCollection is a stack or time series of images. In addition to loading an ImageCollection using an Earth Engine collection ID, Earth Engine has methods to create image collections. The functions ee.ImageCollection() and ee.ImageCollection.fromImages() create image collections from lists of images. You can also create new image collections by merging existing collections.
// Specify a location and date range of interest
var point = ee.Geometry.Point(-76.147, 43.046); // Create a point in the City of Syracuse
var start = ee.Date('2014-06-01'); //Define a start date for filter
var end = ee.Date('2014-10-01'); //Define a end date for filter
// Filtering and Sorting an ImageCollection
var filteredCollection = ee.ImageCollection('LANDSAT/LC8_L1T') //import all Landsat 8 scenes
.filterBounds(point) //filter all scenes using point geometry from above (i.e. limit to Syracuse)
.filterDate(start, end) //filter all scenes using the dates defined above
.sort('CLOUD_COVER', true); //按照云覆盖面积排序
print(filteredCollection);
var first = filteredCollection.first(); //select the first image in the filtered image collection
print(first); //第一幅影像的云覆盖面积最少
// Load a Landsat 8 ImageCollection for a single path-row.
var collection = ee.ImageCollection('LANDSAT/LC08/C01/T1_TOA')
.filter(ee.Filter.eq('WRS_PATH', 15)) //Limit images to those in the path/row over Syracuse
.filter(ee.Filter.eq('WRS_ROW', 30))
.filterDate('2014-01-01', '2015-01-01'); //filter by a start and end date of interest
print('Collection: ', collection); // Convert the collection to a list and get the number of images.
var size = collection.toList(100).length();
print('Number of images: ', size);
// Get the number of images.
var count = collection.size();
print('Count: ', count);
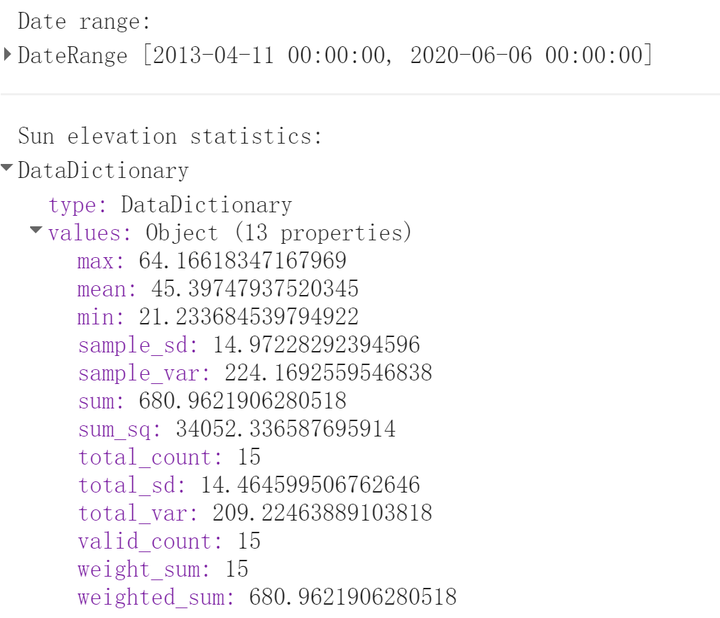
// Get the date range of images in the collection.
var dates = ee.List(collection.get('date_range'));
var dateRange = ee.DateRange(dates.get(0), dates.get(1));
print('Date range: ', dateRange);
// Get statistics for a property of the images in the collection.
var sunStats = collection.aggregate_stats('SUN_ELEVATION'); //统计太阳高度信息
print('Sun elevation statistics: ', sunStats);
// Sort by a cloud cover property, get the least cloudy image.
var image = ee.Image(collection.sort('CLOUD_COVER').first());
print('Least cloudy image: ', image);
// Limit the collection to the 10 most recent images.
var recent = collection.sort('system:time_start', false).limit(10);

Performing image band calculations 进行波段计算
例子:计算两副影像的NDVI差值
/* Create a function to compute NDVI from Landsat 5 imagery where B4 is the NIR band and B3 is the red band. */
var getNDVI = function(image) {
return image.normalizedDifference(['B4', 'B3']);
};
// Load two Landsat 5 images, 20 years apart.
var image1 = ee.Image('LANDSAT/LT05/C01/T1_TOA/LT05_015030_19880619');
var image2 = ee.Image('LANDSAT/LT05/C01/T1_TOA/LT05_015030_20100531');
// Compute NDVI from the scenes.
var ndvi1 = getNDVI(image1);
var ndvi2 = getNDVI(image2);
// Compute the difference in NDVI.
var ndviDifference = ndvi2.subtract(ndvi1);
Map.addLayer(ndviDifference);
导出影像
// Create an image variable (named Landsat) and select three bands.
var landsat = ee.Image('LANDSAT/LC08/C01/T1_TOA/LC08_123032_20140515')
.select(['B4', 'B3', 'B2']); //only select band 4, 3 and 2 for import
// Create a geometry representing an export region.
var geometry = ee.Geometry.Rectangle([116.2621, 39.8412, 116.4849, 40.01236]);
// Export the image, specifying scale in meters and region.
Export.image.toDrive({
image: landsat, //set the name of export image to be landsat
description: 'imageToDriveExample', //set the export image task to be imageToDriveExample
scale: 30, //define scale to 30 meters
region: geometry //set the region of export to predefined geometry
});
附注:
Spatial Reducer: Functions that composite all the images in an Image Collection to a single image representing, for example, the min, max, mean or standard deviation of the images.
• ImageCollection Filter: A series of functions which can be applied to a ImageCollection to find the appropriate image(s) of interest. Specifically, many common use cases are handled by imageCollection.filterDate(), and imageCollection.filterBounds(). For general purpose filtering, use imageCollection.filter() with an ee.Filter as an argument.
.filter(ee.Filter.eq('WRS_ROW',30))
Map a function: This is usually done by repeating the same function over all images in an ImageCollection. Functions can be directly mapped over a collection using collection_name.map(function_name).
【参考】
https://zhuanlan.zhihu.com/p/148196390
![]() Lab 1 - Introduction to the fundamentals of Google Earth Engine API.pdf
Lab 1 - Introduction to the fundamentals of Google Earth Engine API.pdf
https://wap.sciencenet.cn/blog-3428464-1241423.html
上一篇:GEE -- 数据类型(Image,Image Collection)
下一篇:GEE -- 影像分类(1)
全部作者的其他最新博文
- • [转载]太阳同步轨道
- • 膳食指南