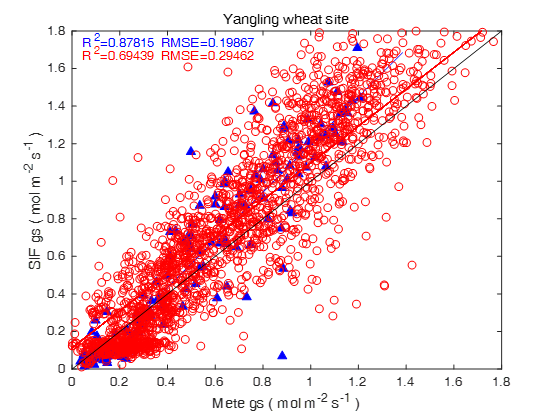
以气孔导度为例:
1 绘图代码:
p=linearfit(gs_wheat_yl_day(:,1),gs_wheat_yl_day(:,2));
[model_GPP_MLR,R2, RMSE]=R2_RMSE2(gs_wheat_yl_day(:,2),gs_wheat_yl_day(:,1))
[x y]=prepareCurveData(gs_wheat_yl_day(:,2),gs_wheat_yl_day(:,1));
rmse=sqrt(mean((x-y).^2));
formu=['R^2=',num2str(R2),' RMSE=',num2str(rmse)]
plot(gs_wheat_yl_day(:,1),gs_wheat_yl_day(:,2),'b^','MarkerFaceColor','b') %绘制每日gs的散点图
x=0.05; y=1.75;
text(x,y,formu,'color','b','FontSize',10)
hold on
plot(gs_wheat_yl_day(:,1),p(1).*gs_wheat_yl_day(:,1)+p(2),'b') %散点图拟合直线
hold on
q=linearfit(gs_wheat_yl_hour2(:,1),gs_wheat_yl_hour2(:,2));
[model_GPP_MLR,R2, RMSE]=R2_RMSE2(gs_wheat_yl_hour2(:,2),gs_wheat_yl_hour2(:,1))
[x y]=prepareCurveData(gs_wheat_yl_hour2(:,2),gs_wheat_yl_hour2(:,1));
rmse=sqrt(mean((x-y).^2));
formu=['R^2=',num2str(R2),' RMSE=',num2str(rmse)]
plot(gs_wheat_yl_hour2(:,1),q(1).*gs_wheat_yl_hour2(:,1)+q(2),'r') %每小时gs结果线性拟合
x=0.05; y=1.68;
text(x,y,formu,'color','r','FontSize',10)
hold on
plot(gs_wheat_yl_hour2(:,1),gs_wheat_yl_hour2(:,2),'ro') %绘制每小时结果散点图
hold on
m=[0 1.8]; n=[0 1.8];
plot(m,n,'k-')
axis([0 1.8 0 1.8])
xlabel('Mete gs ( mol m^-^2 s^-^1 )')
ylabel('SIF gs ( mol m^-^2 s^-^1 )')
title('Yangling wheat site')
hold off
2 R2,RMSE拟合函数
function [model_GPP_MLR,R2, RMSE]=R2_RMSE2(Prediction,measurement)
model_GPP_MLR = fitlm(Prediction,measurement);
R2=model_GPP_MLR.Rsquared.Ordinary;
RMSE = sqrt(sum((Prediction(:)-measurement(:)).^2) / numel(measurement) );
% rmse=sqrt(mean((x-y).^2));

转载本文请联系原作者获取授权,同时请注明本文来自柏延文科学网博客。
链接地址:https://wap.sciencenet.cn/blog-3402238-1314127.html?mobile=1
收藏


